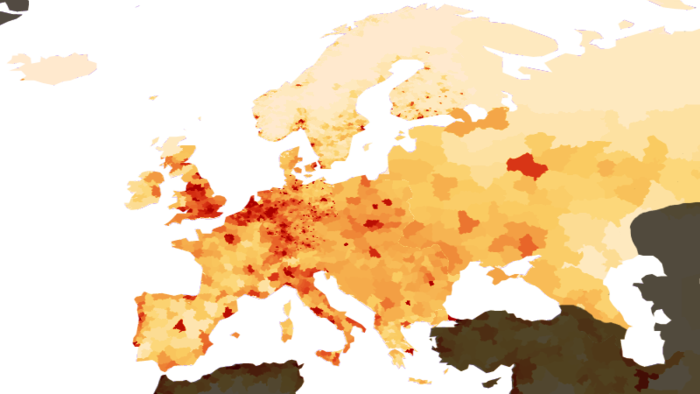
قالب:الجماعات العرقية في أوروپا
This template's initial visibility currently defaults to autocollapse, meaning that if there is another collapsible item on the page (a navbox, sidebar, or table with the collapsible attribute), it is hidden apart from its title bar; if not, it is fully visible.
To change this template's initial visibility, the |state= parameter may be used:
{{الجماعات العرقية في أوروپا|state=collapsed}}will show the template collapsed, i.e. hidden apart from its title bar.{{الجماعات العرقية في أوروپا|state=expanded}}will show the template expanded, i.e. fully visible.
key to font size: sqrt (التعداد بالمليون/10) e.g. Russians: 122 مليون – sqrt(12.2)=349%; Portuguese: 11.6 million – sqrt(1.16)=108%; Icelanders: 0.25 million – sqrt(.025)=16%, but shown as 45% (minimal font size)
البيانات
- "The Peoples of Europe by Demographic Size, Table 1", Pan & Pfeil (2003).[1]
- 2010 Russian Census[2][3]
| Rank (by population size) |
People | Population (million people) |
| 1. | Russians (Europe and Asia) | 122 |
| 2. | Germans (i.e. German-speakers, including Germans, Austrians, German-speaking Swiss, Alsatians, Lorrainers, South Tyroleans, German-speaking Belgians, North Schleswigers etc.) | 89.3 |
| 3. | Italians | 57.0 |
| 4. | Turks (Asia and Europe) | 56.5 |
| 5. | French (i.e. French-speakers, including French, Walloons, French-speaking Swiss, Provençals) | 55.0 |
| 6. | English | 46.0 |
| 7. | Ukrainians (including Ruthenians) | 43.2 |
| 8. | Poles | 38.4 |
| 9. | Spaniards (including Andalusians, Aragonese, Asturians, Cantabrians, Canarians, Castilians, Extremadurans, Leonese, Mirandese and Barranquenhos) | 31.1 |
| 10. | Romanians (including Moldovans) | 22.5 |
| 11. | Dutch (including Flemings) | 20.7 |
| 12. | Greeks | 13.9 |
| 13. | Portuguese (including Galicians) | 11.6 |
| 14. | Hungarians | 11.6 |
| 15. | Catalans (including Algherese, Andorrans, Balearics and Valencians) | 11.5 |
| 16. | Belorusians | 10.2 |
| 17. | Czechs (including Moravians) | 9.80 |
| 18. | Swedes | 8.00 |
| 19. | Serbs | 7.70 |
| 20. | بلغار (including Pomaks) | 6.70 |
| 21. | Irish | 6.10 |
| 22. | Occitans (including Aranese) | 5.95 |
| 23. | Tatars (including Crimean Tatars) | 5.70 |
| 24. | Scots | 5.50 |
| 25. | Finns | 5.34 |
| 26. | Albanians | 5.30 |
| 27. | Danes | 5.10 |
| 28. | Slovaks | 5.00 |
| 29. | Croats | 4.80 |
| 30. | Norwegians | 4.10 |
| 31. | Romany / Sinti | 3.80 |
| 32. | Lithuanians | 3.10 |
| 33. | Slovenes | 1.90 |
| 34. | Chuvash | 1.80 |
| 35. | Macedonians | 1.58 |
| 36. | Bosniaks | 1.56 |
| 37. | Chechens | 1.50 |
| 38. | Latvians | 1.42 |
| 39. | Bashkirs | 1.35 |
| 40. | Jews | 1.30 |
| 41. | Mordvins | 1.10 |
| 42. | Estonians | 1.00 |
| 43. | Circassians | 0.750 |
| 44. | Udmurts | 0.715 |
| 45. | Karelians | 0.700 |
| 46. | Basques | 0.667 |
| 47. | Mari | 0.644 |
| 48. | Rhaeto-Romanics (Friulians, Ladins, Romansh) | 0.621 |
| 49. | Montenegrins | 0.550 |
| 50. | Avars | 0.544 |
| 51. | Welsh | 0.543 |
| 52. | Kashubians | 0.500 |
| 53. | Frisians | 0.462 |
| 54. | Bretons | 0.450 |
| 55. | Ossetians | 0.400 |
| 56. | Maltese | 0.374 |
| 57. | Dargins | 0.353 |
| 58. | Aromanians | 0.336 |
| 59. | Komi Zyryan | 0.336 |
| 60. | Luxembourgers | 0.308 |
| 61. | Kumyks | 0.277 |
| 62. | Lezgins | 0.257 |
| 63. | Icelanders | 0.250 |
| 64. | Ingushetians | 0.215 |
| 65. | Gagauz | 0.200 |
| 66. | Kalmyks | 0.166 |
| 67. | Karachays | 0.150 |
| 68. | Komi Permyaks | 0.147 |
| 69. | Lak | 0.102 |
| 70. | Tabasarans | 0.094 |
| 71. | Sami | 0.093 |
| 72. | Balkars | 0.078 |
| 73. | Nogais | 0.074 |
| 74. | Sorbs | 0.060 |
| 75. | Greenlanders (Inuit) | 0.056 |
| 76. | Faroese | 0.045 |
| 77. | Rutuls | 0.020 |
| 78. | Tats | 0.019 |
| 79. | Vepsians | 0.012 |
| 80. | Tsakhurs | 0.0065 |
| 81. | Karaim | 0.0046 |
| 82. | Izhorians (Ingrians) | 0.0011 |
| 83. | Cornish | 0.0010 |
| 84. | Manx Gaels | 0.0003 |
| 85. | Livonians | 0.0001 |
الهامش
- ^ أ ب Pan, Christoph; Pfeil, Beate S. (2003). "The Peoples of Europe by Demographic Size, Table 1". National Minorities in Europe: Handbook. Wien: Braumueller. p. 11f. ISBN 978-3-7003-1443-1. (a breakdown by country of these 87 groups is given in Table 5, pp. 17–31.)
- ^ Russian Census 2010: Population by ethnicity (in روسية)
- ^ Russian Federation Federal State Statistics Service (FSSS) (2010). "Всероссийская перепись 2010, Материалы. Табл. 7. Национальный состав населения по субъектам Российской Федерации" [All-Russian Census 2010, Materials. Table 7. National Composition of the Populations on the Subjects of the Russian Federation] (Press release) (in الروسية). Moscow.
المراجع
